Don’t tell a weather story about data. Do this instead.
Many weathercasts on TV today feature endless satellite/radar loops and rainbow-colored maps covered with numbers. To the average person, it tends to all look the same. According to research conducted by Magid, 87% of local news viewers say the weather coverage is basically the same on every channel.
Broadcast meteorologists can differentiate their weather coverage and produce more captivating weather hits by applying Meteorology Marketing. Instead of telling a story about data, use the data to tell a story. Start by identifying the essential information viewers want to know and need to know. Then, select the data that will best deliver that message.
Not all data is made for TV. Some data is more suitable for forecasting and beyond the understanding of the average person. Used creatively, however, broadcast meteorologists can convert common weather data into compelling graphics and differentiate their weather coverage from the competition.
Here are four ways to creatively use common weather data and make it more viewer-friendly:
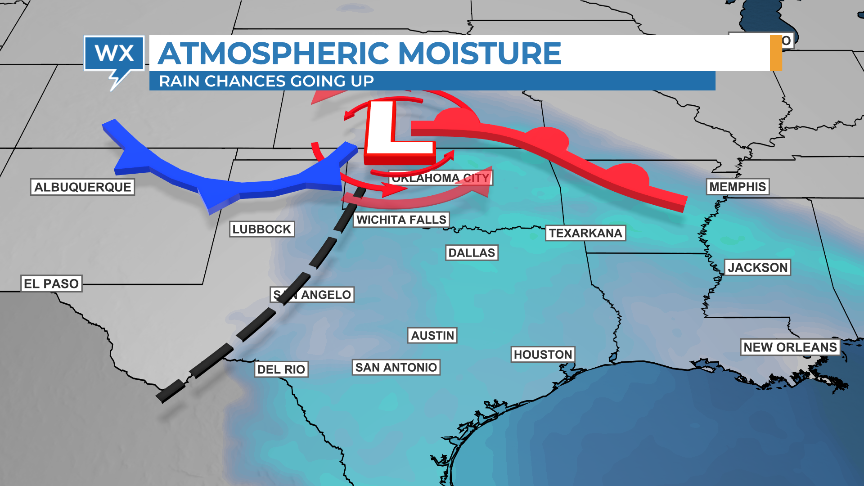
Rename the data using conversational language
Precipitable Water doesn’t mean anything to non-meteorologists. However, Atmospheric Moisture is an easy concept to understand, especially when broadcast meteorologists use it to explain the increase in the chance of rain. Same data, different name.
Renaming weather data using conversational language makes the information accessible to the average person. Correlation Coefficient Dual-Pol radar data could be renamed Debris Tracker, Vorticity could be titled Low-Level Spin, and CAPE could simply be called Instability.
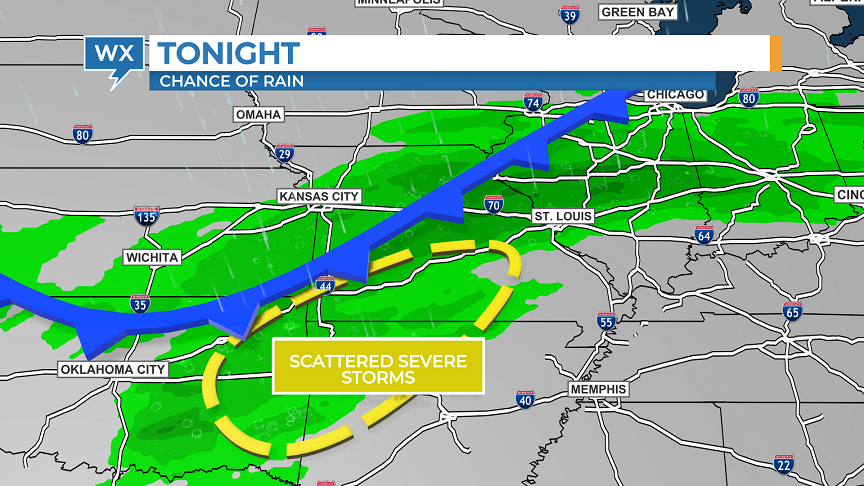
Use data as a graphic element
Rather than drawing polygons by hand, broadcast meteorologists can use contour weather data as a graphic element within a scene to help deliver the essential message.
Next time the forecast models don’t accurately depict the formation, timing, or intensity of future precipitation, use the NDFD Probability of Precipitation to show areas where rain is generally expected.
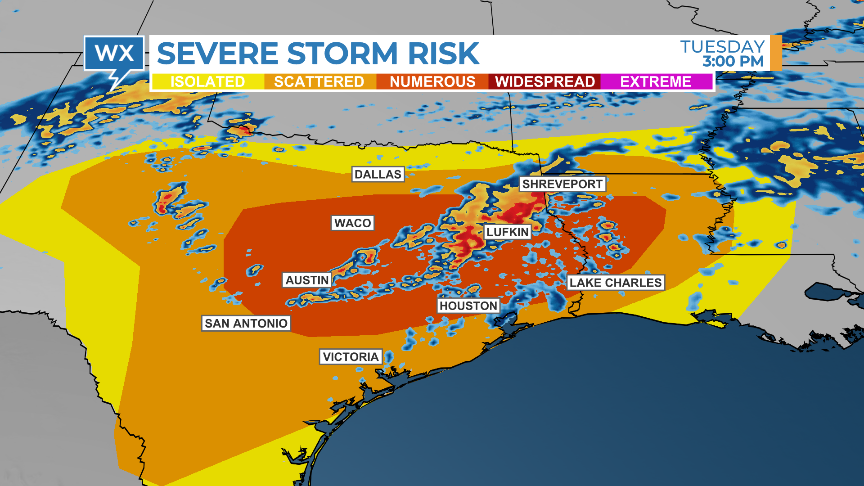
Combine Data to Deliver One Message
Most broadcast meteorologists usually create separate scenes for each type of data. Combining the data into one scene tells a more impactful weather story.
To emphasize the threat of severe weather, combine the Convective Outlook from the Storm Prediction Center with future radar model data.
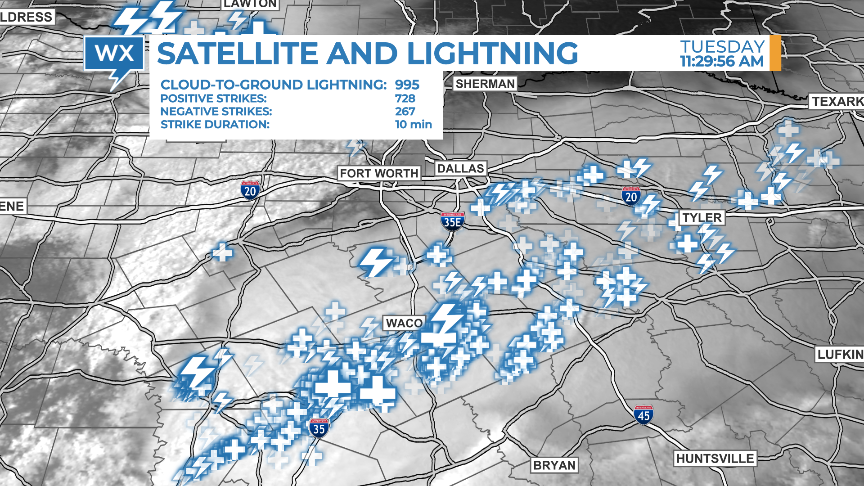
Combining high-resolution visible satellite imagery with lightning data can help identify which clouds are producing strong thunderstorms and which are weakening.
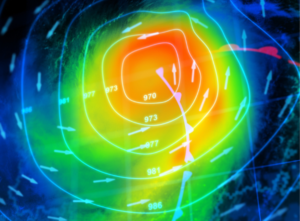
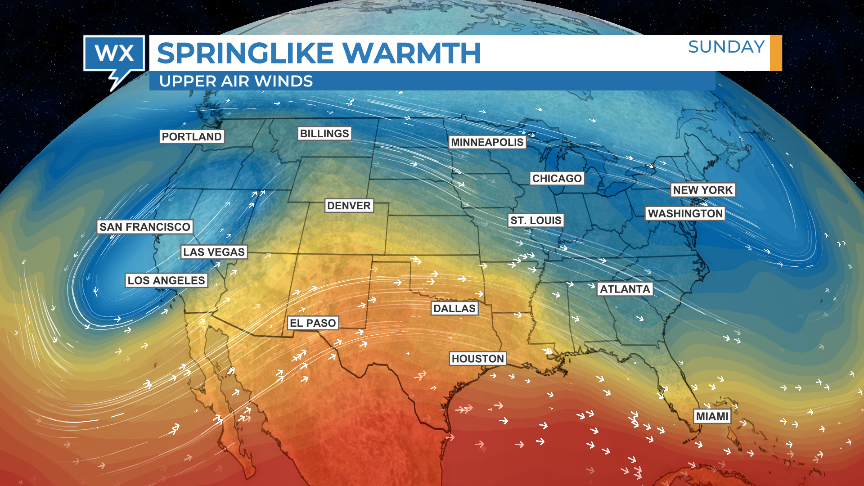
Create Custom Color Tables
Depending on the message you want to deliver, custom color tables might make the data easier to understand. However, when creating your own color tables, avoid rainbow colors. Shades of green and red can appear identical to people who are color-blind, which is almost 10% of the population.
Broadcast meteorologists have access to more data than ever. The Max system from The Weather Company, for example, can access over 70 different types of data. 70! That’s in addition to KML files and other third-party data that can be imported into the system.
By using common weather data creatively, renaming data using conversational language, incorporating data as graphic elements, combining data to deliver one cohesive message, and creating custom color tables, meteorologists can engage viewers and make weather forecasts more accessible and captivating.
The sky really is the limit when it comes to weather data. The key is how all that data is utilized.
Tim Heller is an AMS Certified Broadcast Meteorologist and Weather Communications Coach. He helps local TV stations and broadcast meteorologists level up their on-air performance and off-air productivity.