RESOURCES FOR
BROADCAST METEOROLOGISTS
The resources on this page are offered free of charge to help broadcast meteorologists communicate more effectively every day, on every platform. New content will be added regularly. Check back often.
MAX REALITY SCENES
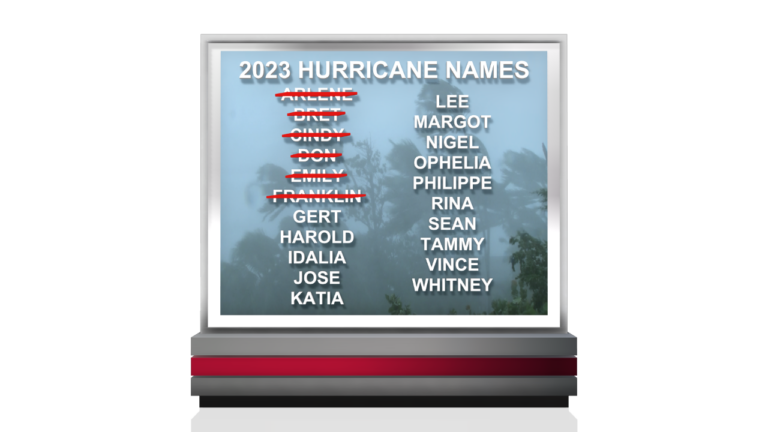
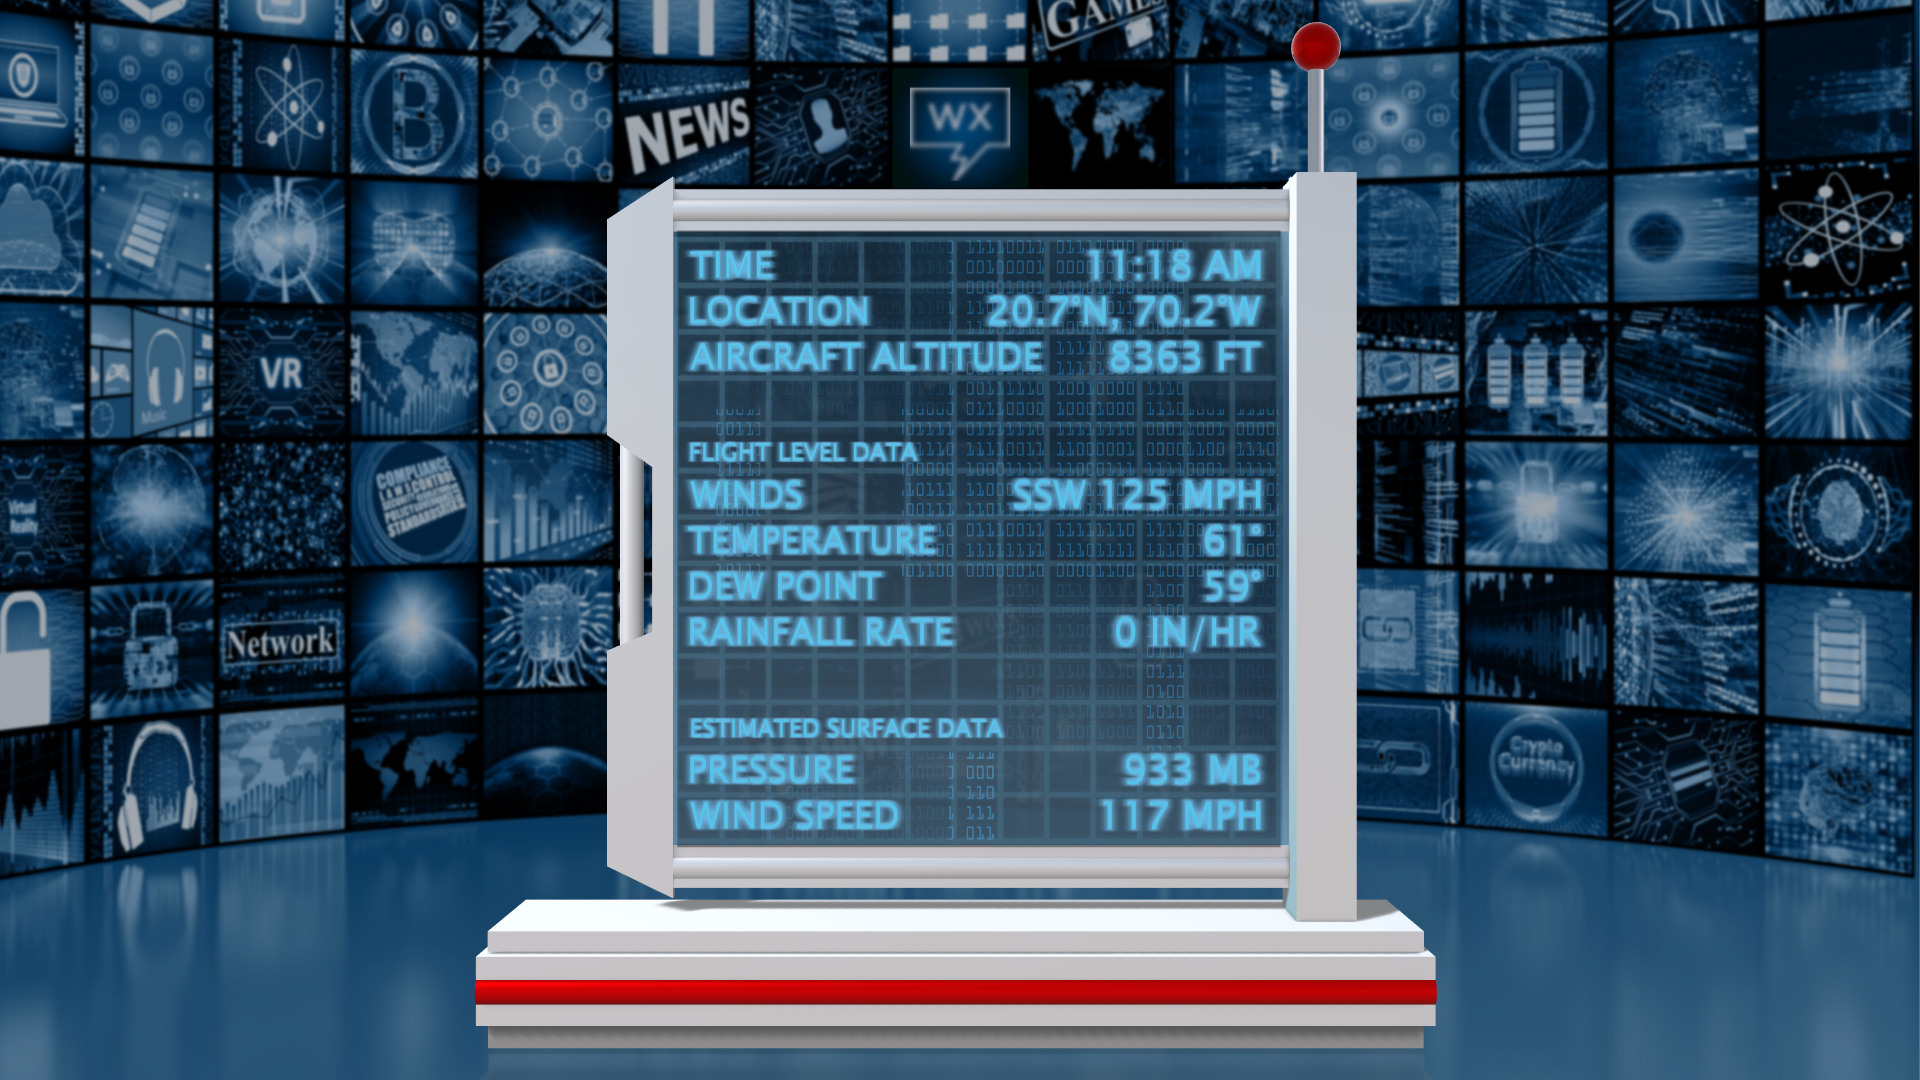
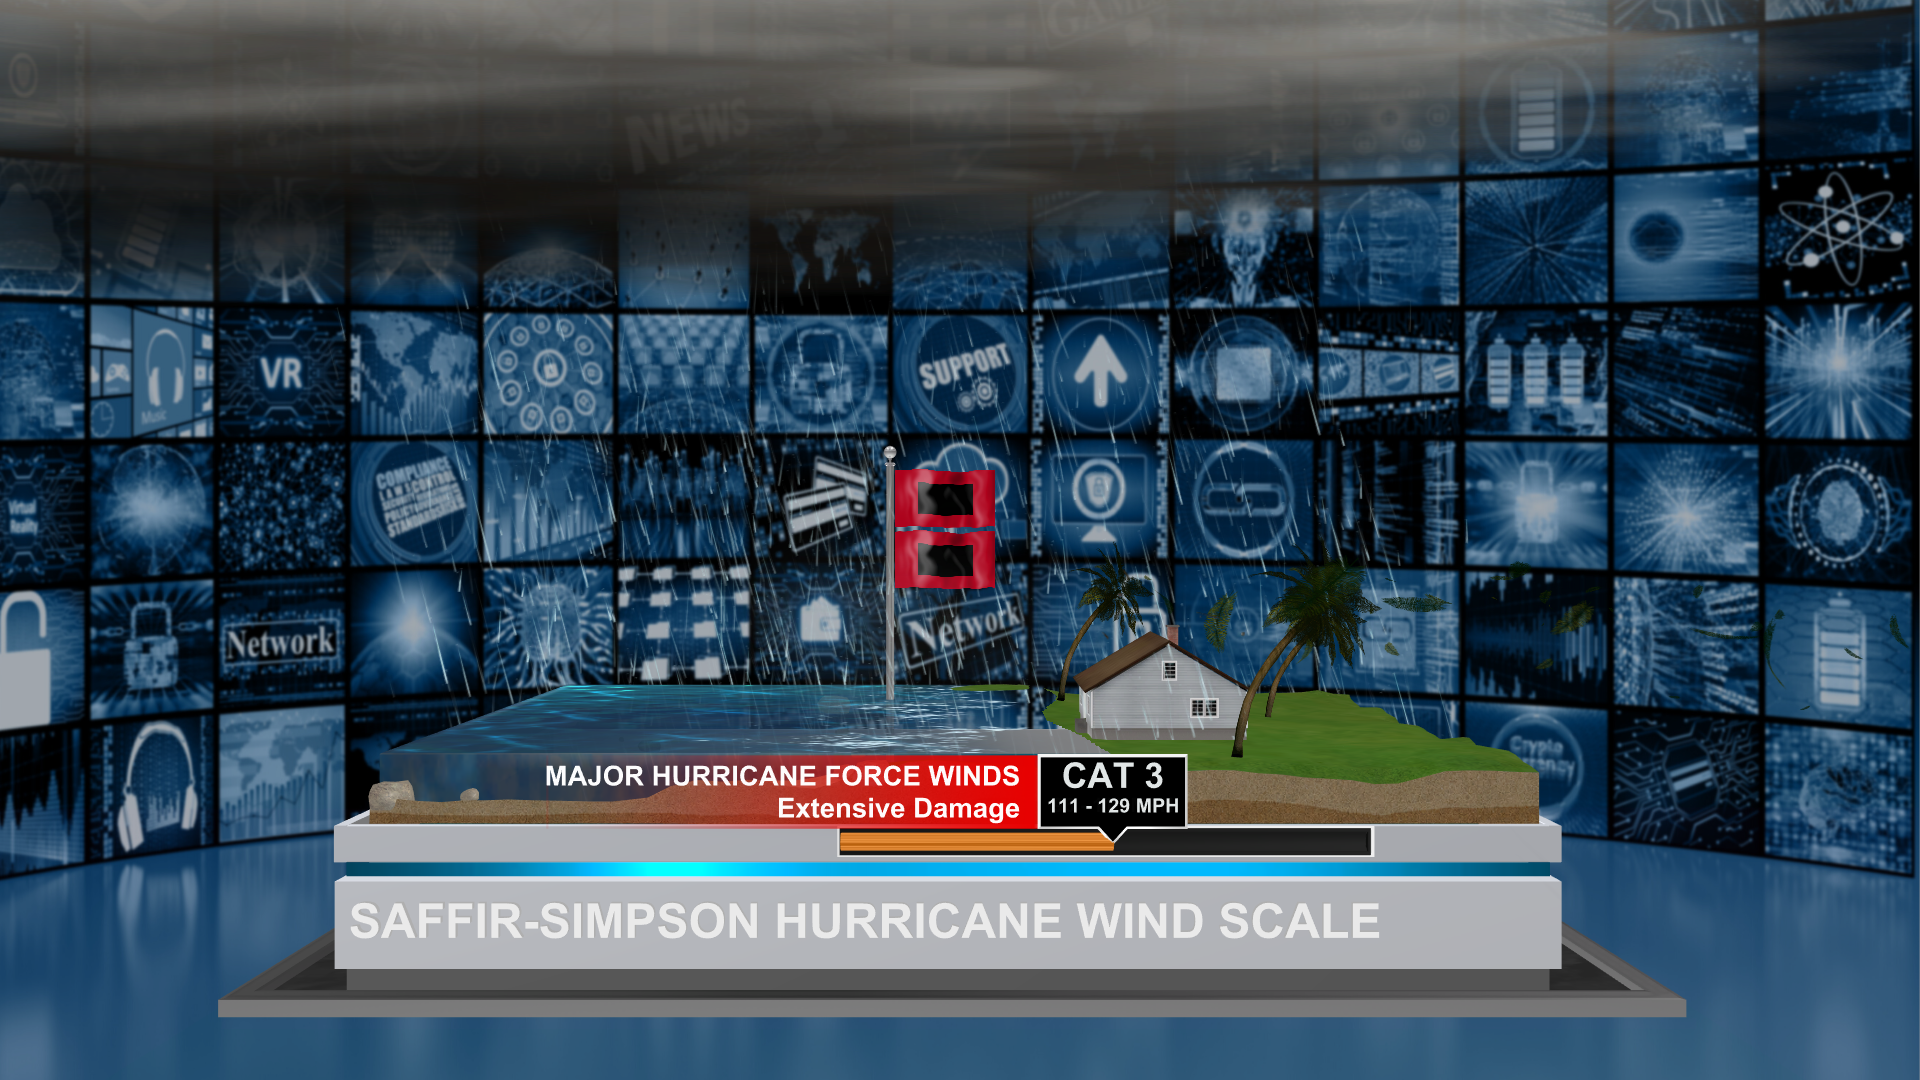
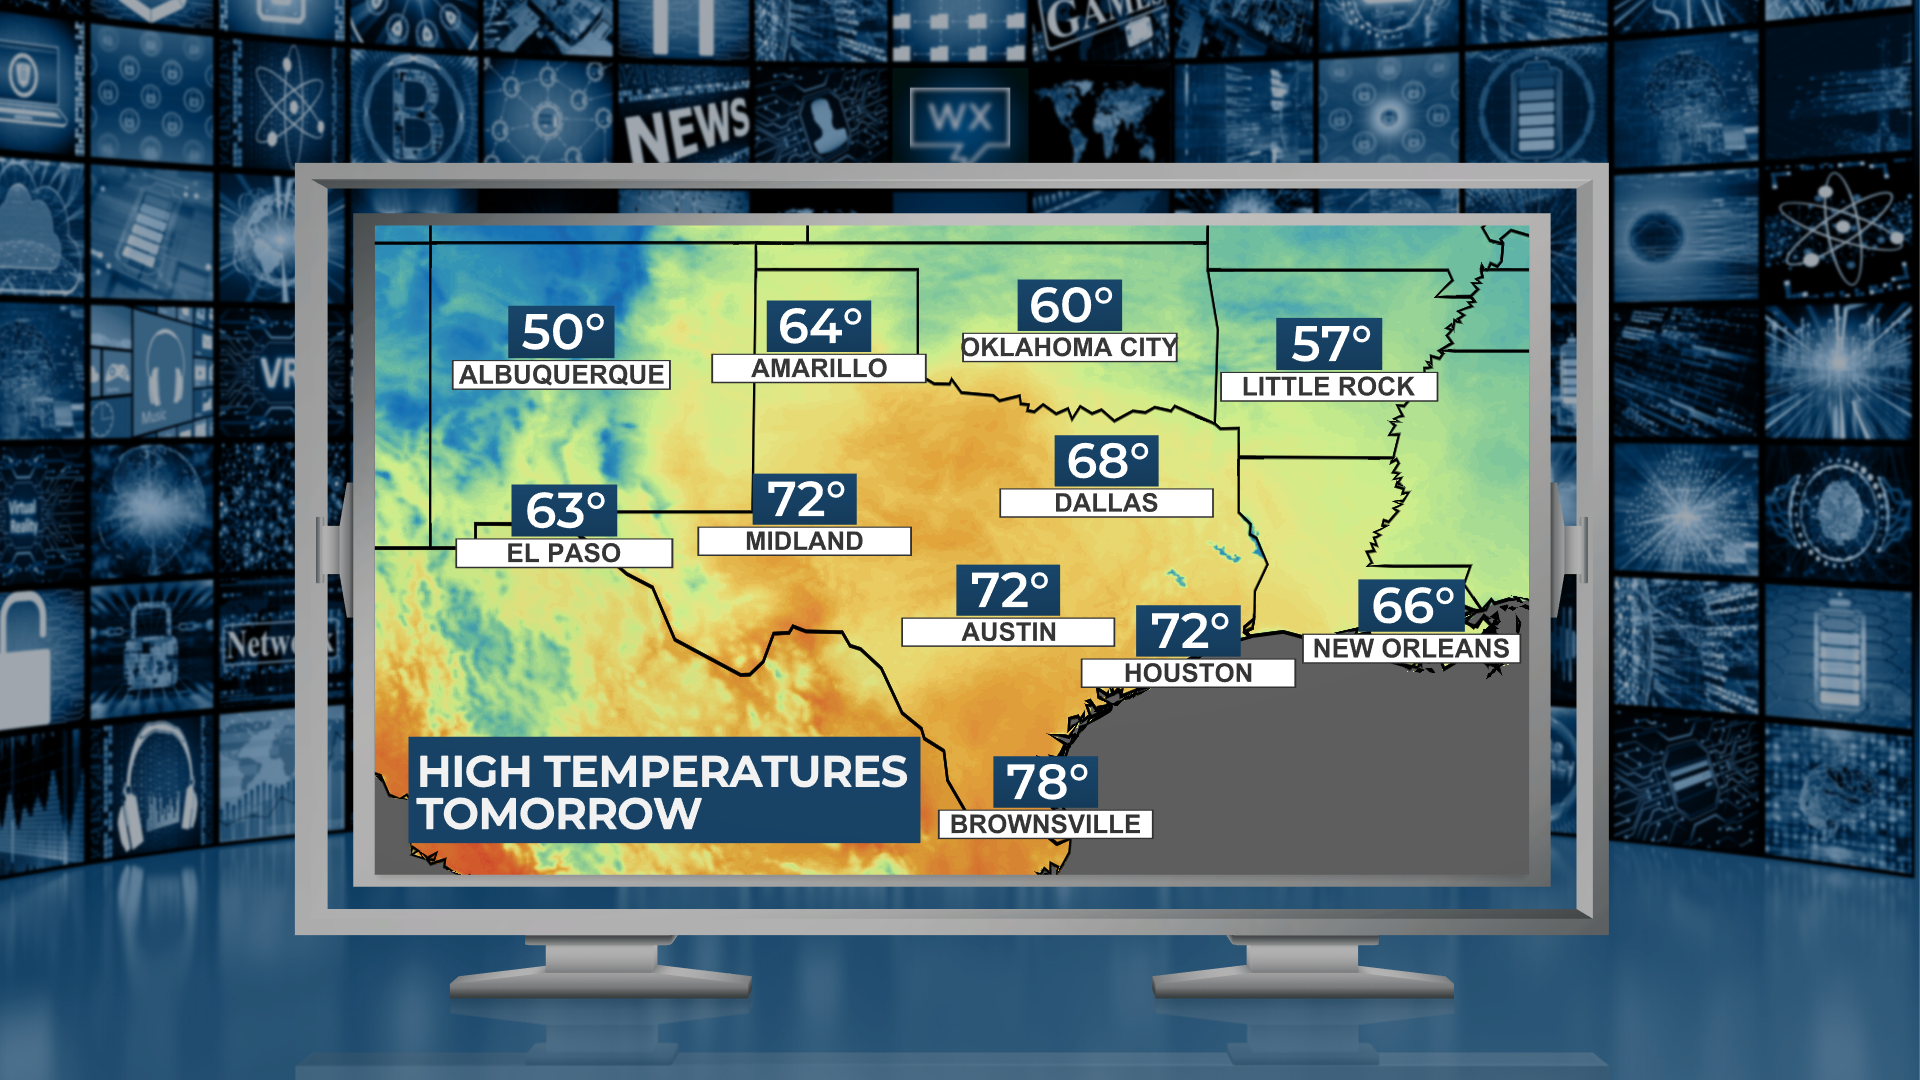
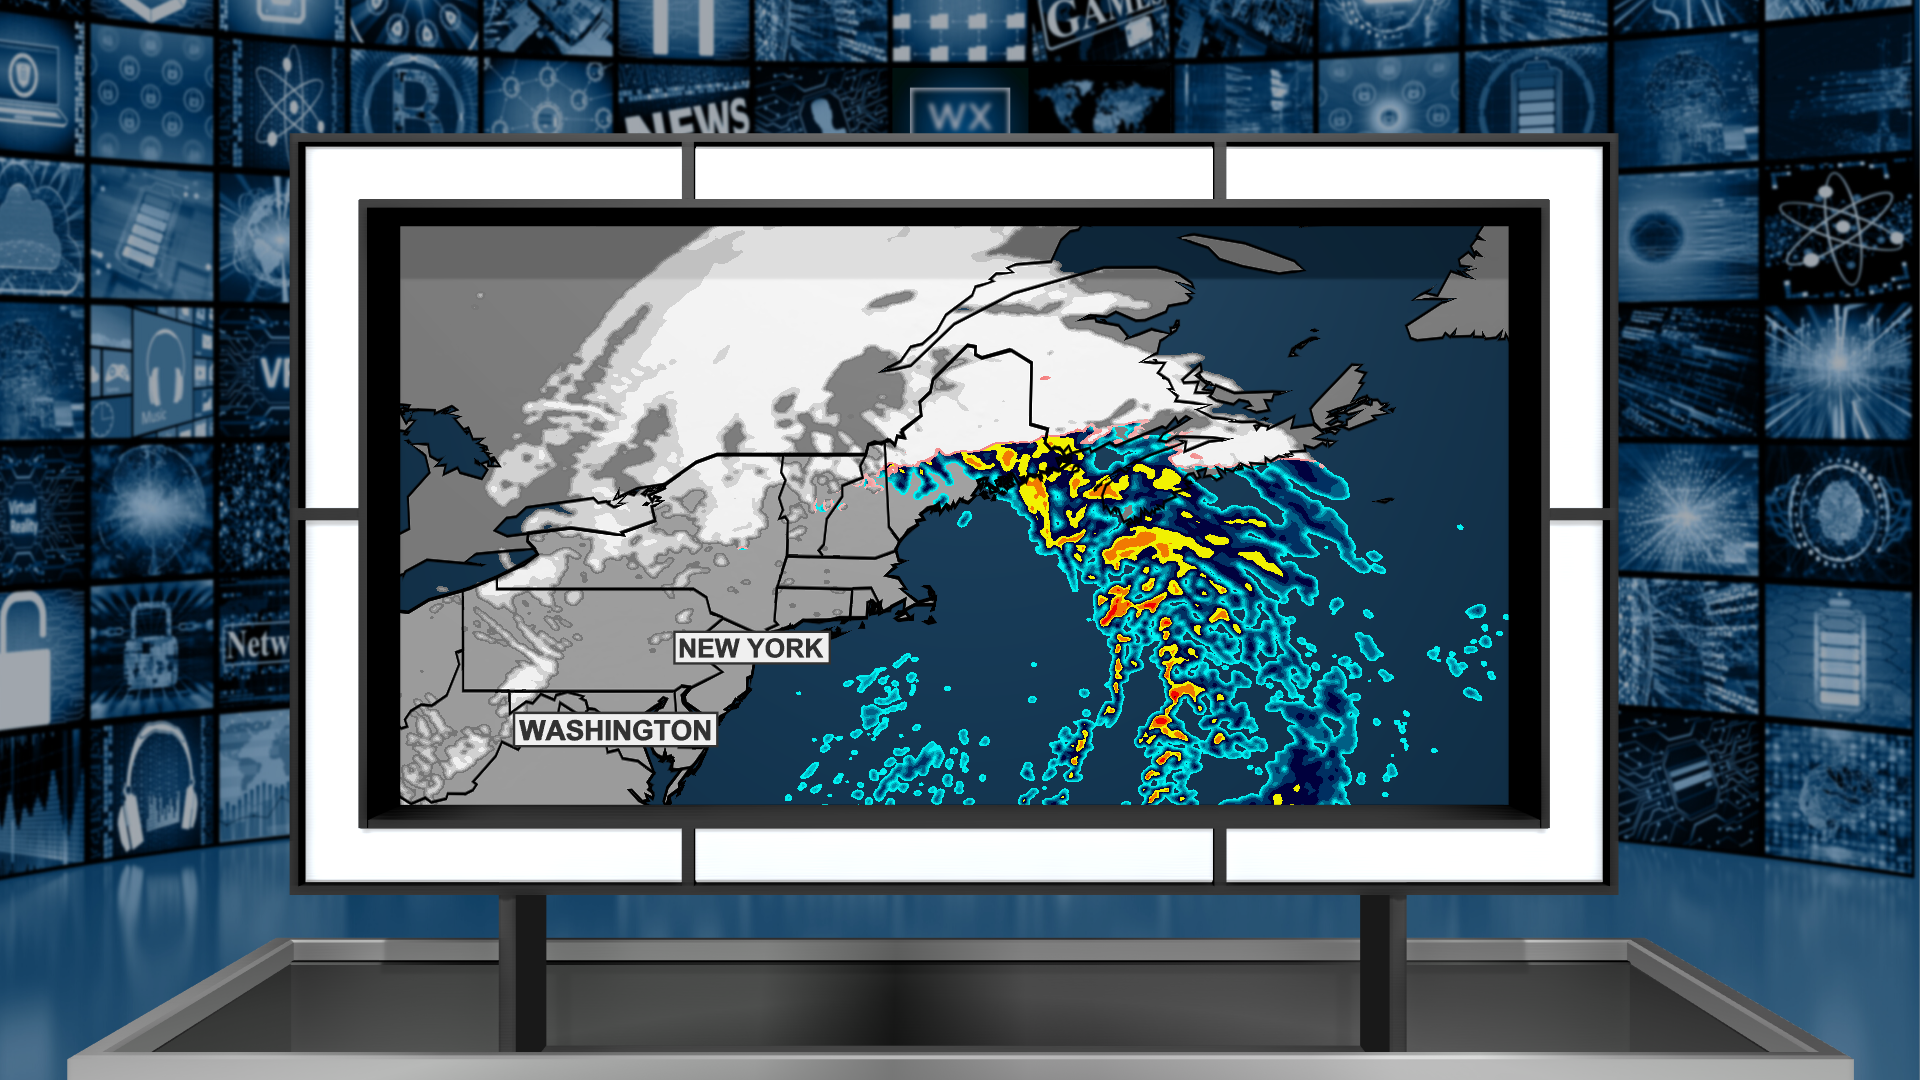
These original scenes, created by Tim Heller, are designed to be used exclusively with Max Reality software developed by The Weather Company, an IBM Business.
The images below link to files stored on The Weather Community forum.
You may have to sign in with your TWC credentials to download the scene.
Looking for more Max Reality ideas? Click here to download a table of content suggestions from Tim Heller.
Tim Heller explains how the Meteorology Marketing can enable broadcast meteorologists to fulfill the weather brand promise and communicate more effectively and efficiently every day on every platform.
CVD-Safe Color Tables
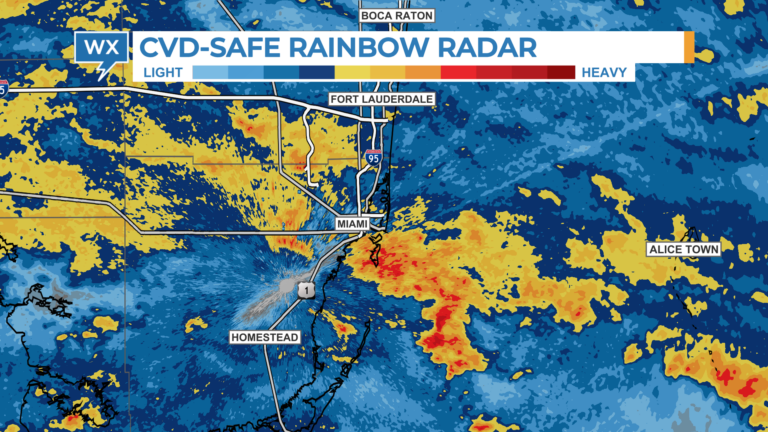
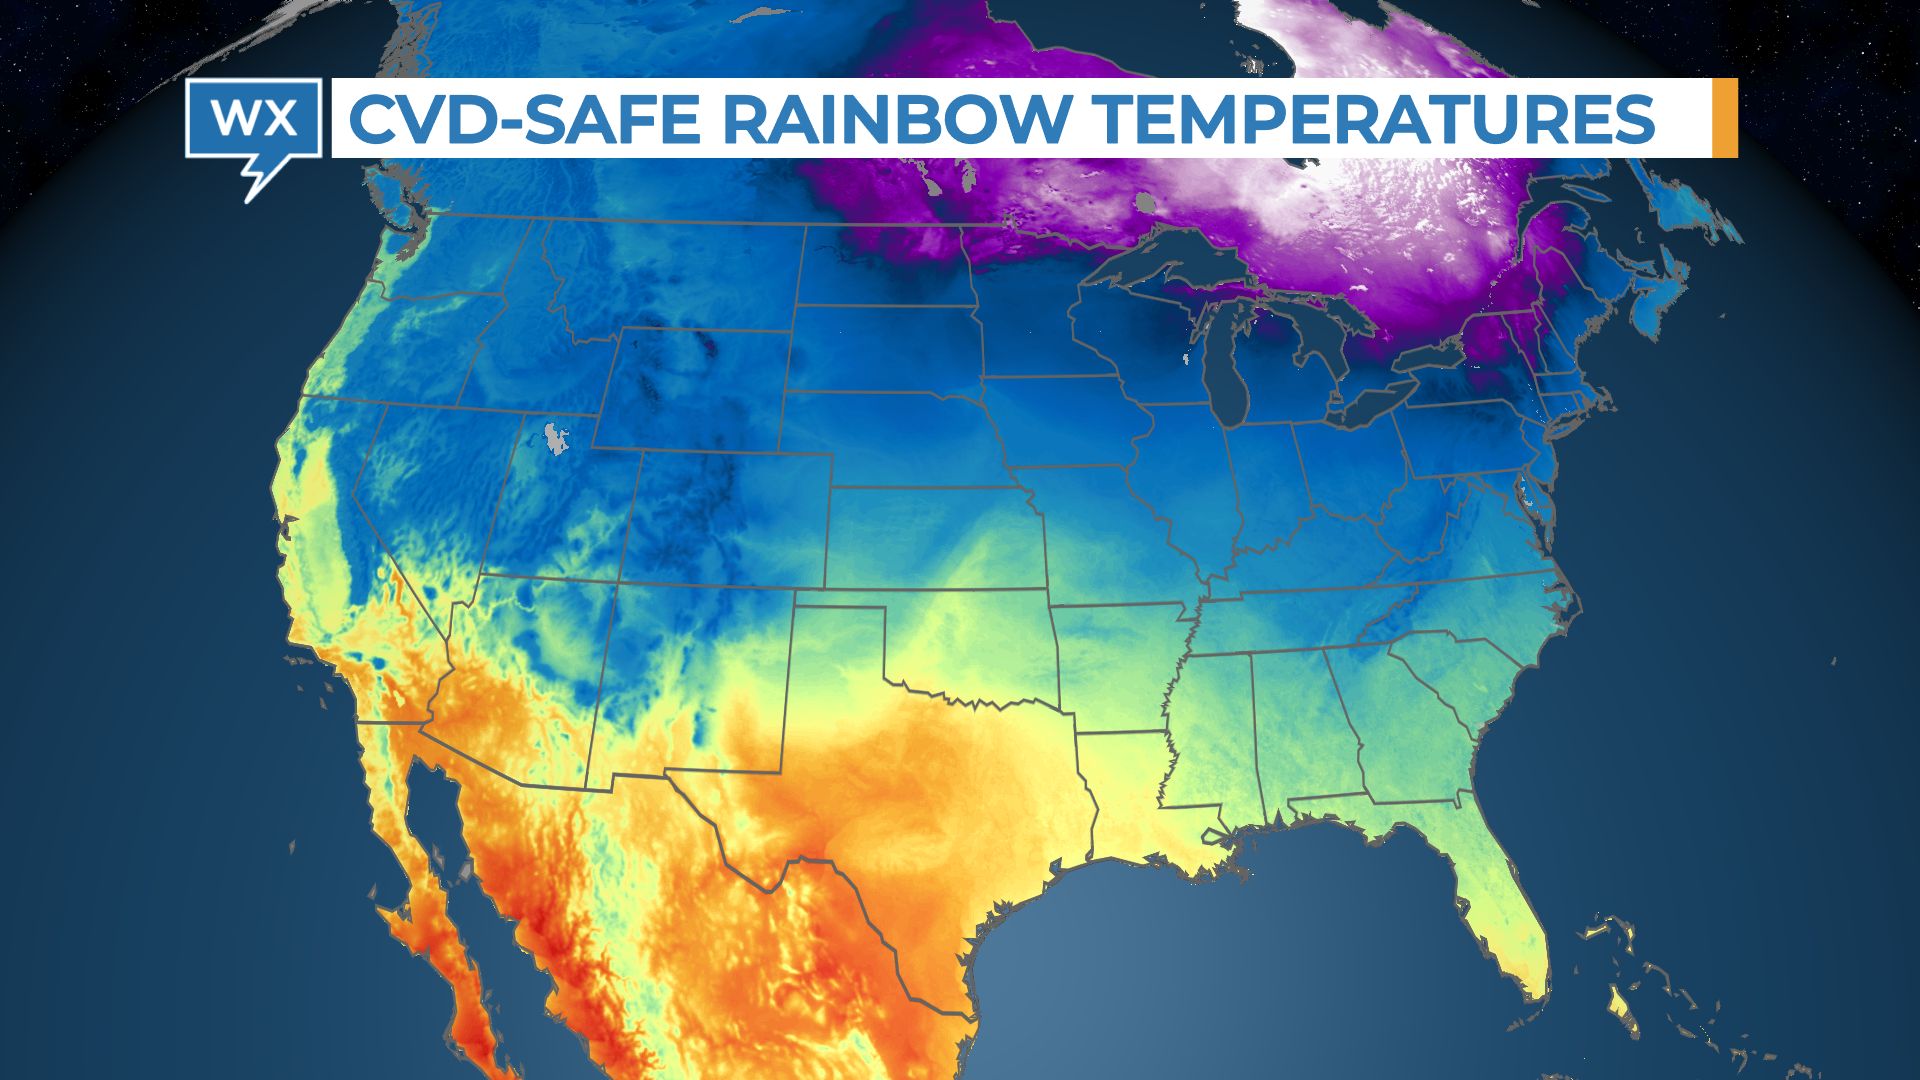
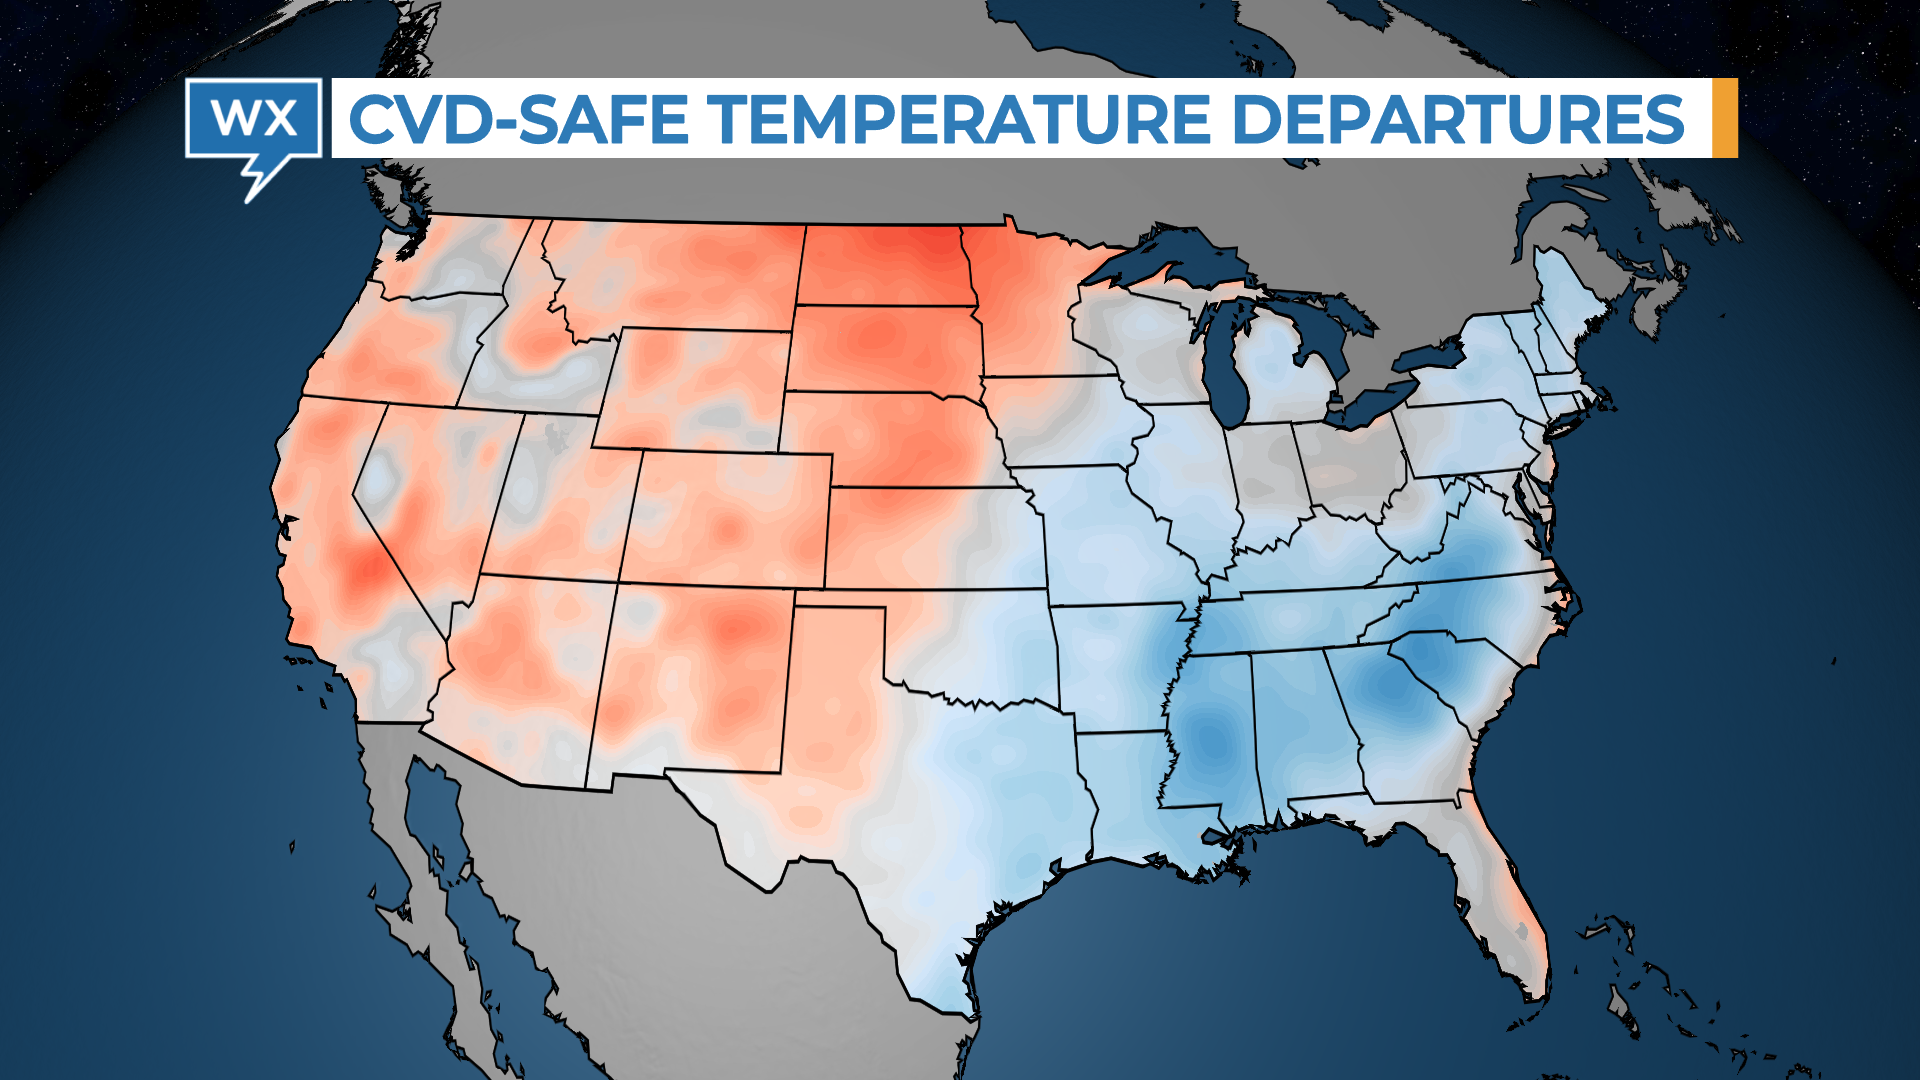
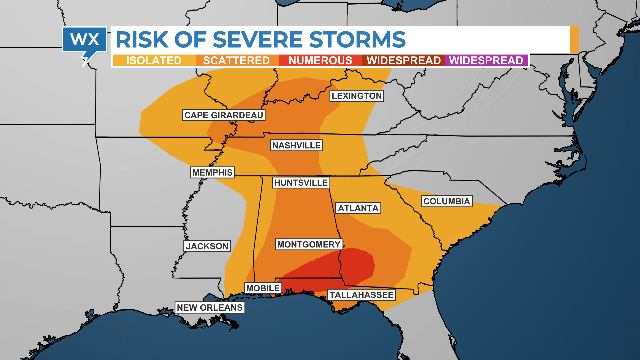
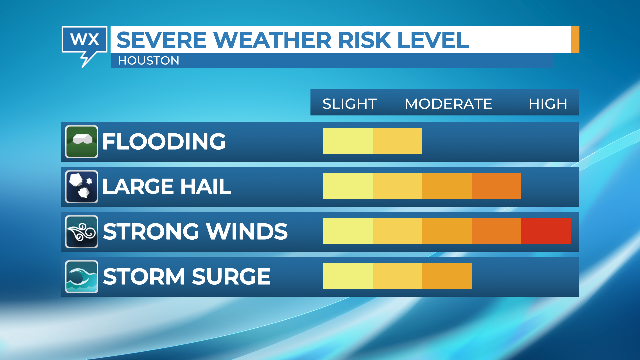
The National Eye Institute estimates 8% of males and .5 of females are color-vision deficient (CVD) or colorblind. These individuals have difficulty differentiating shades of certain colors. The color tables below are CVD-safe for all types of color-blindness.
Click on the image to download a PDF document listing the red-green-blue levels for each color.
For assistance making custom CVD-Safe color tables, use the online ColorBrewer tool.
Test any graphic for CVD-Safe colors using this Color Blind Vision Simulator.
The American Meteorological Society offers guidance on using color as a communication tool.
The World Meteorological Organization published guidelines for weather graphic design (pdf).
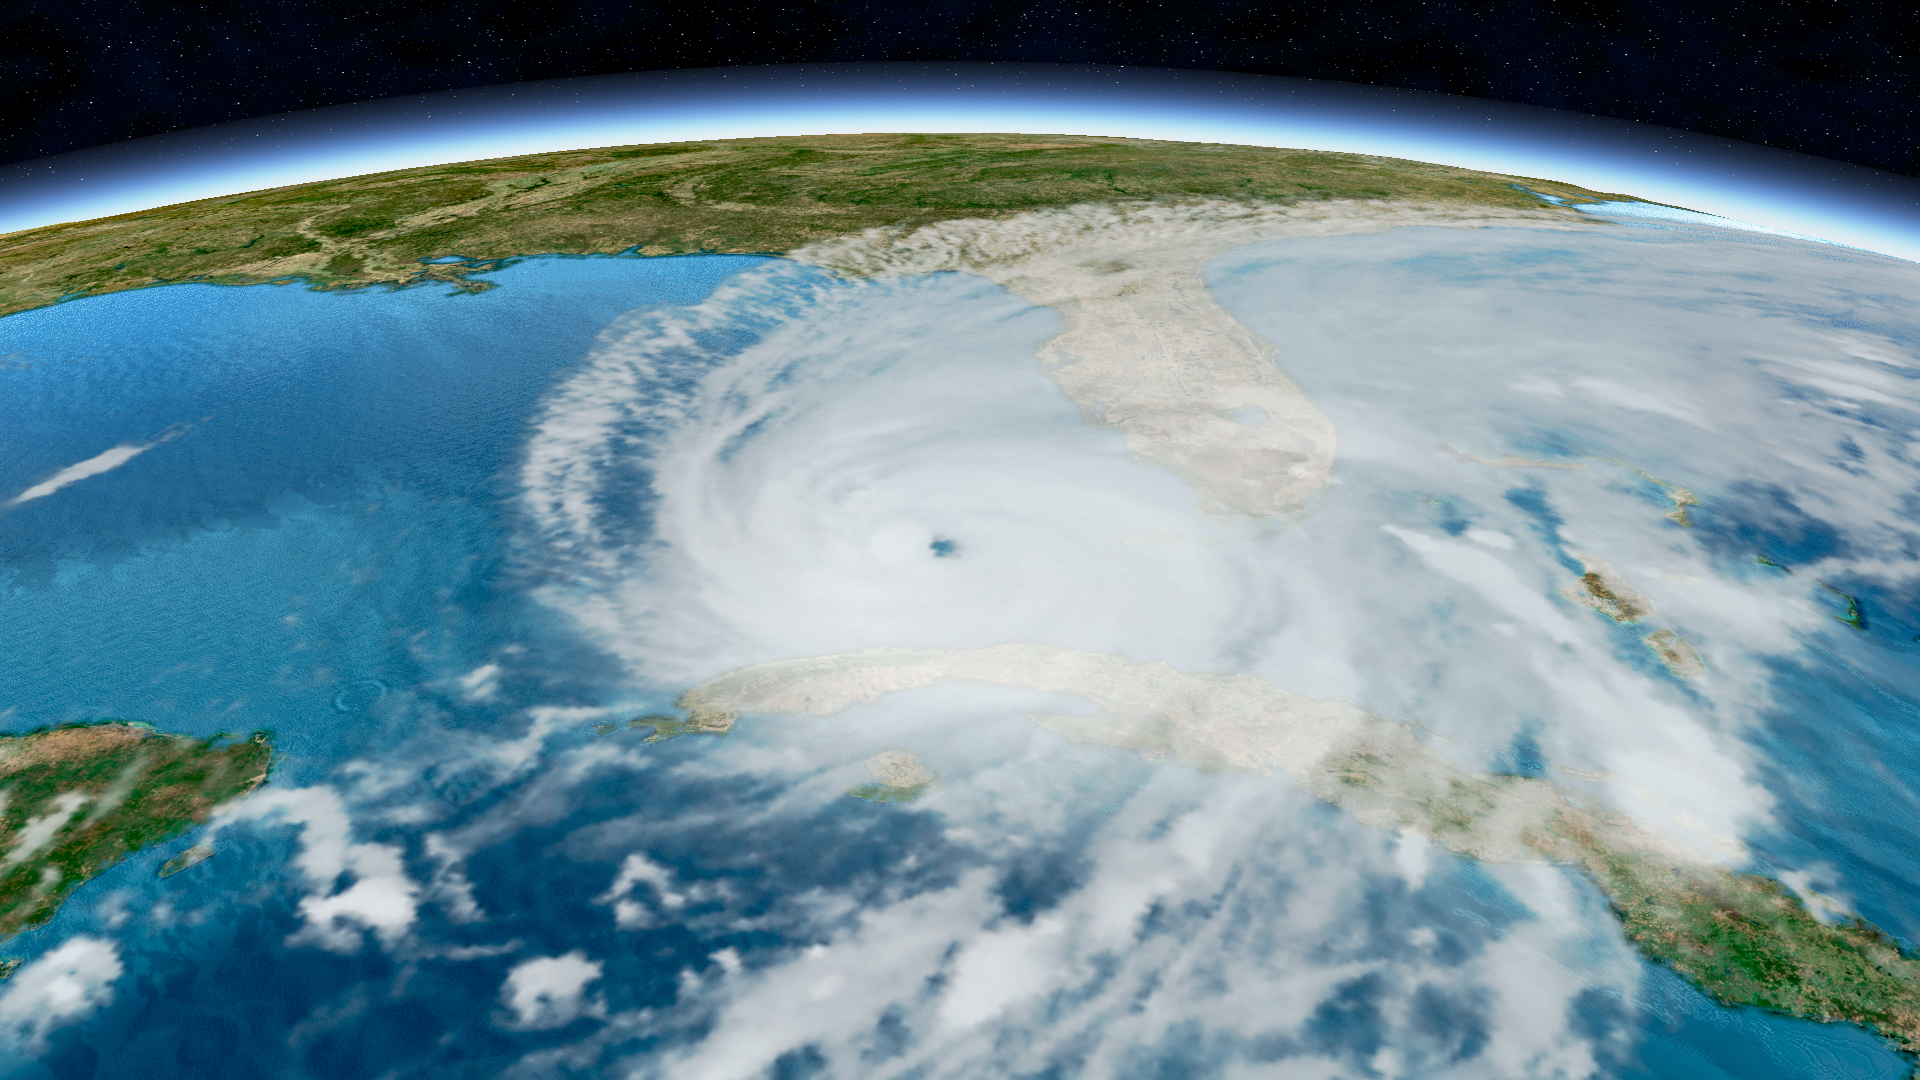
This special tropical satellite scene for the Max weather graphics systems is designed to simulate the view from the International Space Station. A new “Brighter” color table emphasizes the texture of the clouds. The movement is purposefully slow and subtle. This scene works great for weather teases, bump shots, and IDs.
Click here to download this free scene from HellerWeather.
This scene is designed to be used with Max software developed by The Weather Company, an IBM Business.
GOOGLE SHEETS FOR CSV FILES
Google Sheets can be used to create CSV files that can be imported into Max to plot non-traditional weather data. Click on each link below, then select File > Make a copy to save it on your Google Drive.
After updating the information in the Google Sheets, select File > Download > Comma Separated Values (.csv)
Navigate to WSI > Digital Media > Custom > ImportedData and save the file here.
Navigated CSV files must be saved in WSI > Digital Media > Custom > NavImportedData.
Calculate the latitude and longitude for any location in Google Sheets using Geocode by Awesome Table.
Do your weather hits always deliver essential information?
Do you produce digital content that is timely and relevant?
Do you participate in daily news editorial meetings?
These are just a few of the things covered in the Self-Evaluation Tool developed by HellerWeather
Are you looking for professional development? Do you need performance coaching or career guidance? Are you ready to elevate your Max Reality presentations? HellerWeather offers several coaching and training opportunities, including an online master class called WxComm Pro.
Start by booking a free 30-minute introductory coaching session with Tim Heller. Click the link below and pick a day and time that fits your schedule.
NEWS & INSIGHTS:
TOP STORIES

The Pitch: A Home Run Connection between Baseball and Television News
The transition to weather is not a throwaway moment, pardon the pun.

Making Every Hit Count: Tips for Producing First Weather
Choosing what to cover at the top of the newscast should be a deliberate decision.

News and Weather: Working Together for Comprehensive Coverage
Why broadcast meteorologists should walk into the newsroom and meet the producers

