10 More Best Practices to Improve Radar Coverage
My blog post on the best practices for using radar during severe weather generated a lot of good feedback and recommendations from fellow broadcast meteorologists.
Here are some additional best practices for radar coverage. All comments are used with permission, and some are lightly edited for clarity.
11. Use live streaming radar to track storms
Brad Panovich from WCNC in Charlotte pointed out that something essential was missing from the first list. “#1 should be: Stop using NOWRAD!!”
When I wrote the first article, I assumed all broadcast meteorologists know that composite radar data shouldn’t be used to track local storms. But apparently, some don’t know this.
So, let’s be clear: always use live streaming radar to track severe weather. Always. Composite radar data, called NOWRAD on The Weather Company’s TruVu Max and C0X on Baron Lynx, is at least fifteen minutes old and usually smoothed to the point where important details are removed.
READ THE FIRST BLOG POST: 10 BEST PRACTICES TO IMPROVE RADAR COVERAGE
12. Check radar smoothing settings
Live streaming radar can also be smoothed to the point of being imperceptible. “No smoothing on live radar either” added James Aydelott from KOKI in Tulsa. “Pick zero or one notch above zero” on the radar smoothing settings.
13. Timelapse at a slower speed
Alden German from WHAS in Louisville, says “If you’re going to animate, use a slower speed. The radars that animate super fast aren’t useful. If you use a slower animation, you can better see how the storm has evolved.”
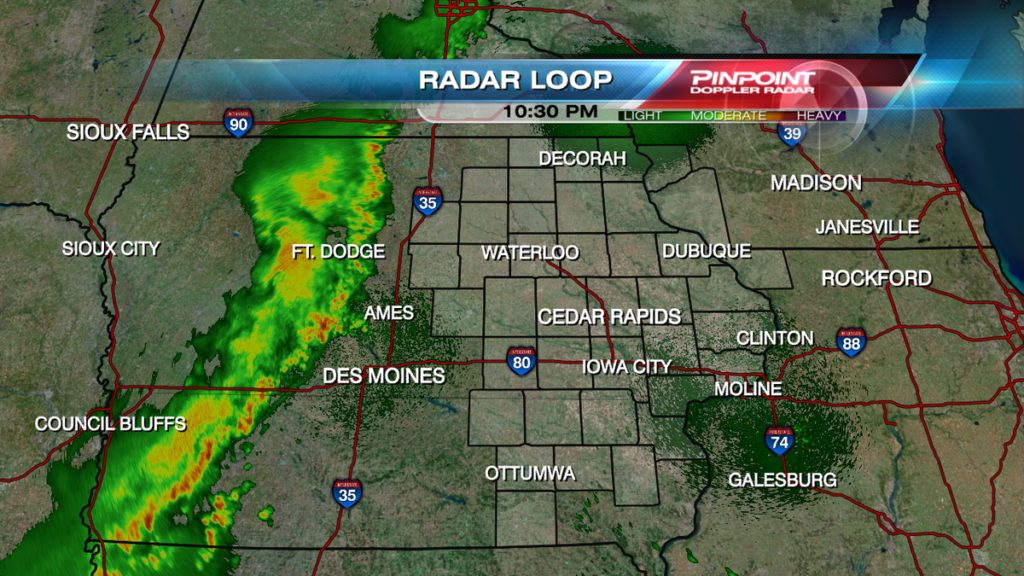
14. Less data is better than more
Justin Gehrts, formerly with KCRG in Cedar Rapids, Iowa, works in a market between NEXRAD sites and often shows multiple radars to cover his area. But when tracking individual storms, he recommends only using the nearest radar site and shutting off all data except for live radar. “I’ve seen NEXRAD, lightning, and hail in between the two. You see the rainbow palette of the storm, various shades of white and blue above that, and lightning bolts. I can’t follow that, and I’m a meteorologist. Your viewers are going to be even more confused.”
15. Explain the colors
Radar displays are naturally very colorful and often very confusing. Cheryl Nelson from Prepare with Cher added, “Remember to explain what the different colors on the radar depict. This is common sense to broadcast meteorologists, but not to everyone else.”
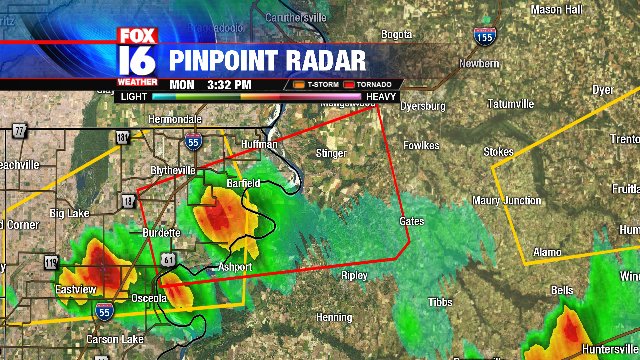
16. Coordinate color tables
“Use standardized watch/warning colors!!” stressed Gerard Jebaily from KSHB in Kansas City. Several others agreed on using standardized colors, so every tornado and severe thunderstorm watch and warning is the same color on every TV station in the market.
17. Be specific regarding storm warnings
Jeff Baskin from KLRT in Little Rock added, “Point out major towns that are in a warned county but outside the polygon. Be specific about who is in the warning and who is not.”
18. Give the viewer time to figure out where they are
Chris Higgins from KTVI in St. Louis says broadcast meteorologists need to stop moving the map. “This is actually something I have to remember sometimes myself. We know what we are looking at, but the viewer needs more time to get their perspective and know what part of the map you are looking at and where they are relative to it.”
Likewise, Don Slater from WAVY in Norfolk suggests meteorologists “think like a movie maker” when putting together their weather hits. “Have a wide, establishing view to orient your viewer as to where everything is. Then a medium shot on the general, trouble spot area you’ll be investigating. Then go in tighter and tighter. Finish with a wide shot, possibly a time-lapse, once again giving the big picture.”
19. Translate weather data into weather stories
Paul Gross from WDIV in Detroit suggests explaining radar data using everyday language. “Telling people that 70 mph wind gusts are possible doesn’t mean much to a lot of people. However, telling them that ‘we received a confirmed report of significant house damage in the downriver area’ is impactful, and will be much more successful in getting them to heed the call to action.”
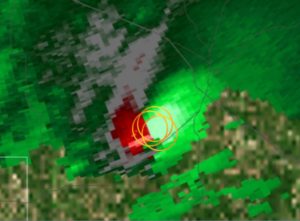
20. Meteorology first
The last item on this list is probably the most important. “Know your stuff but also be aware not all situations are textbook,” urged Ricky Matthews from WYCB in Bristol, Virginia. “Research what a TDS is. Know what can result in a false TDS. Make sure it’s co-located with the couplet and ZDR matches too.”
“Just because you can, doesn’t mean you should.” John Dissauer from WTTV in Indianapolis reminds us that weather graphics computers are powerful tools, capable of displaying a lot of different data in a lot of different ways. “I see a lot of things used during severe weather coverage that shouldn’t be used. Mainly I think that’s because the operator doesn’t know what the data is displaying, and perhaps more importantly, what it doesn’t display or indicate.”
Tim Heller is an AMS Certified Broadcast Meteorologist, Talent Coach, and Weather Content Consultant. He helps local TV stations and broadcast meteorologists communicate more effectively on-air, online, and on social media.
Read more News & Insights from HellerWeather